This web page was produced as an assignment for Genetics 564, an undergraduate capstone course at UW-Madison.
What is a phylogeny?
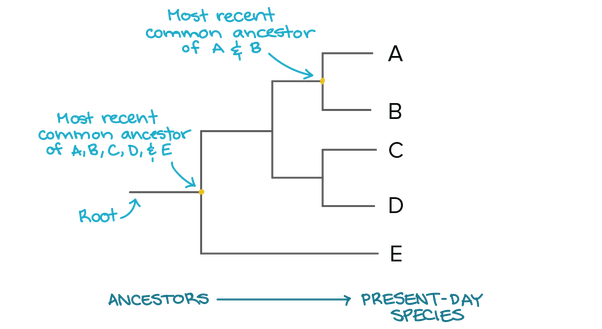 Figure 1. Example of a simple phylogenetic tree.
A phylogeny or phylogenic tree is a line diagram that shows the evolutionary relationships amongst various species by comparing either protein or nucleotide sequence data (Figure 1). These diagrams can be constructed for individual genes, whole organisms, or even entire groups of organisms, and they depict evolutionary relationships by determining common ancestors that make up the branch points of the tree. For example, in the case of the CNBP protein associated with myotonic dystrophy type 2 (DM2), a phylogeny can be constructed to determine how different CNBP is across different organisms. Organisms with branch points that are nearer to one another are considered to be more related or less evolutionarily diverse in their makeup of the CNBP gene, while organisms with distant branch points are more evolutionarily diverse [1].
Phylogenies are important because they show the evolutionary relationships amongst genes and species, and ultimately help scientists answer important questions like why certain genes evolved, what regions of a gene or protein are most conserved/vital to its function, and what kinds of model organisms would be most important for studying a specific type of gene or protein [1].
Phylogenies are important because they show the evolutionary relationships amongst genes and species, and ultimately help scientists answer important questions like why certain genes evolved, what regions of a gene or protein are most conserved/vital to its function, and what kinds of model organisms would be most important for studying a specific type of gene or protein [1].
Three methods for phylogenic tree construction:
Neighbor JoiningNeighbor joining is a widely used approach for generating phylogenetic trees because the algorithm used can generate trees for large data sets very quickly. The neighbor joining algorithm is a cluster algorithm that joins together pairs of taxa until a full tree is constructed. Distances of branches are estimated from a scoring system that determines how similar/dissimilar to sequences are [2]. |
Maximum LikelihoodMaximum likelihood is a slower, more computationally intense method of phylogenic analysis. First, a simple phylogeny is constructed using a quick method like neighbor joining. Following this, branch lengths are then optimized for a specified evolution model [3]. |
Average DistanceAverage distance differs from neighbor joining and maximum likelihood in the fact that it does not optimize the branch lengths for the phylogenic tree. As a result, this method implies all species from a given common ancestor have diverged equally [3]. |
Phylogenic Trees for CNBP Protein
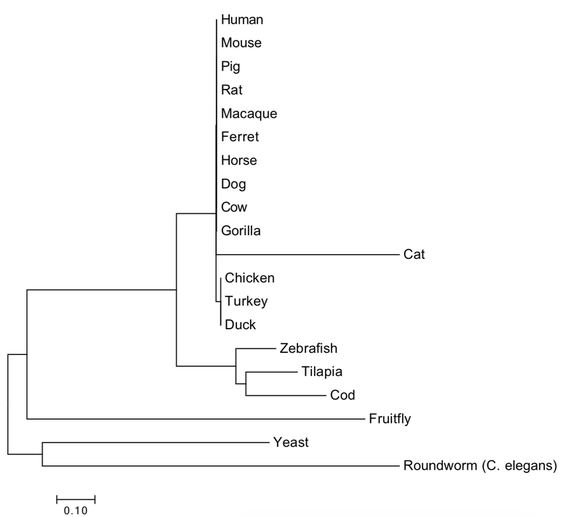
Figure 2. Maximum likelihood tree for CNBP in various species.
|
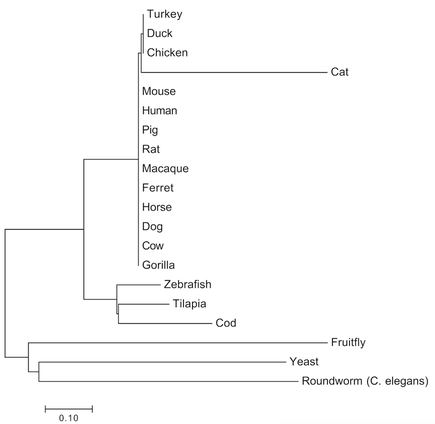
Figure 3. Neighbor joining tree for CNBP in various species.
|
The maximum likelihood and neighbor joining tree* suggest a high degree of similarity and recent common ancestor of the CNBP protein amongst mammals, so it is likely that they would make for great model organisms due to the recent evolutionary split of this gene (Figure 2 and 3). While CNBP gene mutations can result in DM2 phenotypes for humans, such as muscle wasting, the presence of CNBP in yeast--an organism obviously lacking in muscles--suggests that CNBP may have evolved other, non-muscle related functions that still make it a relevant gene for this species.
Discussion
The two phylogenetic trees generated for CNBP yielded similar topologies. Fruitfly, yeast, and C. elegans share the oldest common ancestor with the human form of CNBP, thus suggests these groups diverged long ago. There is a large mammal cluster found within each tree suggesting that CNBP very conserved amongst these organisms. The small bony fish clade is conserved within each tree as well, and suggests that these fish share a more recent common ancestor to humans than do the fruitfly, yeast, and C. elegans. Where the cat homolog of CNBP fits in evolutionarily is ambiguous, as there appears to be a polytomy in the maximum likelihood tree. The fact CNBP split very long ago for the fruitfly, yeast, and C. elegans suggests that new novel functions may have evolved for CNBP in these organisms.
*Note: Phylogenetic tree was constructed using FASTA protein sequences (see below) obtained from the Ensembl database that were aligned via ClustalOmega and MEGA software.
| fasta.pdf |
References
- Baum, D. (2008). Reading a Phylogenetic Tree: The Meaning of Monophyletic Groups. Retrieved March 16, 2018, from https://www.nature.com/scitable/topicpage/reading-a-phylogenetic-tree-the-meaning-of-41956
- Boekhout, T., Fell, J. W., & Kurtzman, C. P. (2011). The yeasts: A taxonomic study. Amsterdam: Elsevier.
- Yang Z, Rannala B. Molecular phylogenetics: principles and practice. Nat Rev Genet. 2012 Mar 28;13(5):303-14. doi: 10.1038/nrg3186.
Header: https://albertonykus.deviantart.com/art/The-Cartoon-Guide-to-Vertebrate-Evolution-551603446
